The Arctic is warming at a pace that defies easy comprehension—nearly four times faster than the rest of the planet—and the ground beneath Alaska is beginning to shift in ways that could reshape industries, economies, and communities for decades to come. For the energy sector, which has spent billions building pipelines, roads, and drilling platforms across the permafrost-rich North Slope and Interior, the slow, steady thaw of frozen ground is no longer the only concern. Abrupt events—sudden collapses, sinkholes, and landslides triggered by rapidly melting ice—are becoming more common, and without precise data, operators are navigating a landscape that is literally turning to mud beneath their feet.
This is where H. Webb, a researcher at the Renewable and Sustainable Energy Institute at the University of Colorado Boulder, and her team have stepped in with a groundbreaking resource: the Alaska Permafrost Thaw Database, now in its second iteration. Released as an open-access tool, this comprehensive dataset compiles 19,540 documented thaw features across Alaska—spanning everything from field observations to satellite imagery—dating back to 1950. It’s not just a catalog; it’s a real-time window into the Arctic’s shifting terrain.
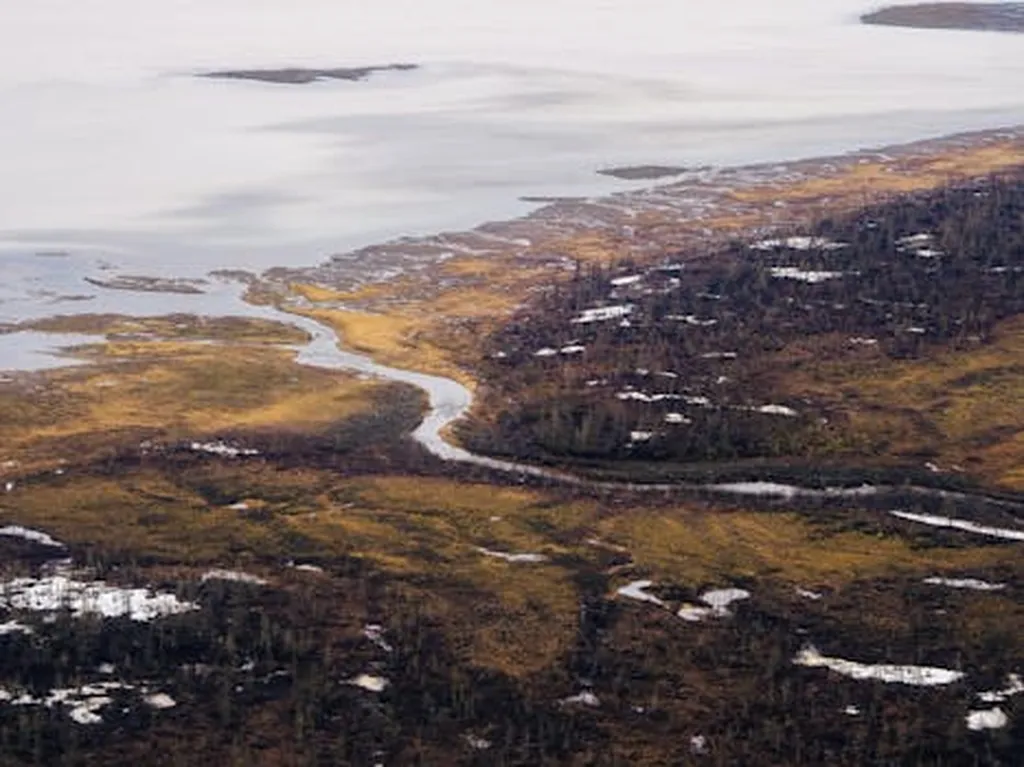
“What we’re seeing is that abrupt thaw features—like thermokarst slumps and retrogressive thaw slides—are clustering in lowland areas and depressions,” Webb explains. “Meanwhile, gradual thaw is more common on sun-exposed slopes, where solar radiation accelerates melting.” That distinction matters for energy infrastructure. Pipelines built on flat, low-lying tundra may face different risks than those traversing south-facing slopes, where solar heating can deepen thaw over time.
The commercial implications are significant. The Trans-Alaska Pipeline System, for instance, runs through some of the most dynamic permafrost zones in the state. Operators already spend millions annually on monitoring and mitigation, but as Webb’s analysis reveals, current ground-ice maps—often used for planning—are too coarse to predict fine-scale risks. “There are substantial mismatches between where we expect thaw to occur based on existing maps and where we’re actually seeing it happen,” Webb says. “That’s a red flag for infrastructure planning.”
For energy companies, the database offers a way to prioritize inspections, redesign routes, or even relocate facilities before thaw undermines stability. It could also guide where new renewable energy projects—like wind or solar farms—might be sited with lower risk of ground instability. The open-access model means firms don’t have to build their own thaw-mapping systems from scratch.
Published in *Earth System Science Data* (a journal whose name translates to *Daten des Erdsystems* in German, emphasizing its focus on quantifiable Earth observations), the database is hosted on Zenodo, with all versions available for download. Webb’s team plans to expand it further, incorporating more field data and higher-resolution imagery to refine predictions.
As the Arctic continues to warm, the energy sector’s ability to adapt will depend on tools like this one—data-driven, transparent, and built for real-world use. For companies operating in the North, the message is clear: the ground is changing, and ignoring it isn’t an option.